I do have a couple of leftover diary ideas about the primaries -- hint: I think the Clintons are bluffing if they say they don't want revotes in Florida and Michigan -- but in the meantime, there's no way I'm going to let something like Survey USA's comprehensive set of general election polls pass without providing an update to my general election projections.
In addition to all the other polls, there are a couple of other wrinkles from the last update:
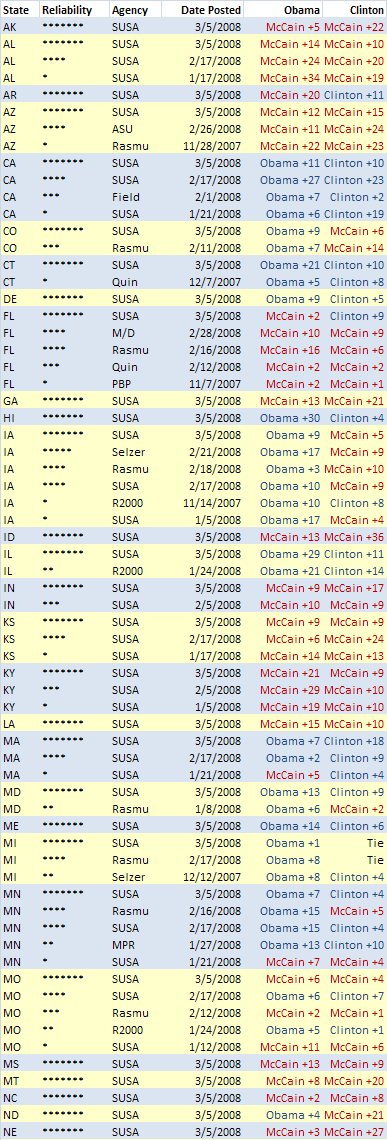
- I've now included a reliability rating for each poll, and the polling averages are weighted based on this reliability rating. This reliability rating is based on two factors: the pollster's track record, and how recent the poll is. You'll see that the new Survey USA polls basically max out the reliability rating as they're both very recent and come from a very good pollster. But, I do look at older polls too; it would be silly to conclude, for instance, that a general election poll from early March is incredibly more meaningful than a general election poll from mid-February. Note that I do not throw the data out just because a particular pollster has released a more recent poll, although these sort of "redundant" polls do receive a penalty to their reliability score. BTW/FWIW: there is some empirical backing for the way I weight the different polls, based on a review of 2004 data, but it is as much an artform as a science at this point. The complete set of polls I've now included is below.

- I've continued to include a regression-based estimate as a "poll" for each state to help stabilize the data and account for outlier polls. However, the coefficients for this regression have been updated (in fact, they update automatically as I plug in new data). The variables are basically the same as before: John Kerry's vote share in 2004, the percentage of Baptists/Southern Baptists (hurts Obama, helps Clinton), and federal fundraising data for each of Obama, Clinton, and McCain. I've dropped the variable for LDS/Mormon voters, which wasn't statistically significant for either candidate (to my surprise, Obama polled pretty well in Utah). However, I've added a variable for the percentage of African-Americans in each state, which is showing up just on the verge of statistical significance. For every 10% increase in African-American population, Obama gains a net of about 4.5 points relative to Clinton. This doesn't matter in all that many places, since the states that have a higher African-American population also tend to have more white Baptists -- a group among which Clinton trounces Obama. But, Obama's ability to motivate greater black turnout could be decisive in a couple of swing states with relatively large black populations, like Michigan and Virginia.
- Speaking of swing states, I'm now reporting another new parameter in my output, which is the state that "swings" the election in each of the simulation runs. The way that this works is as follows: I arrange the states from best to worst in order of Obama's (or Clinton's) vote share in each of the 5,000 simulations. I then count electoral votes upward until he equals or exceeds 269 EV. The state that puts him over the top is literally the swing state for that simulation run. For example, one of the McCain-Obama simulation runs ordered the states as follows:
Washington, DC +3=3
Hawaii +4=7
Vermont +3=10
Illinois +21=31
Connecticut +7=38
Maine +4=42
Oregon +7=49
California +55=104
New York +31=135
Rhode Island +4=139
Delaware +3=142
Colorado +9=151
Maryland +10=161
Wisconsin +10=171
Massachusetts +12=183
Iowa +7=190
New Hampshire +4=194
Washington +11=205
New Mexico +5=210
New Jersey +15=225
Michigan +17=242
Nevada +5=247
Ohio +20=267
Virginia +13=280
North Carolina +15=295
Alaska +3=298
Kansas +6=304
Pennsylvania +21=325
etc. etc.
Virginia was the swing state in this particular simulation run; it was the state that bumps Obama over 269 electoral votes. But note that a whole bunch of other weird stuff happened in this particular simulation; Obama polled better in Colorado than in Massachusetts, for instance, and he had a rough go of things in Pennsylvania. What the swing state metric is designed to do is to account for all these different sorts of scenarios in an election in which the map is being redrawn, and serve as a proxy for where the candidate should allocate his or her resources. A state like California almost never comes up as the "swing state" since even though Obama and Clinton might occasionally lose California, they will never do so except when they are getting blown out everywhere. On the other hand, relatively small states like Nevada can sometimes be quite important.
Enough for the caveatting and explanation ... here were the results of the 5,000 simulation runs:
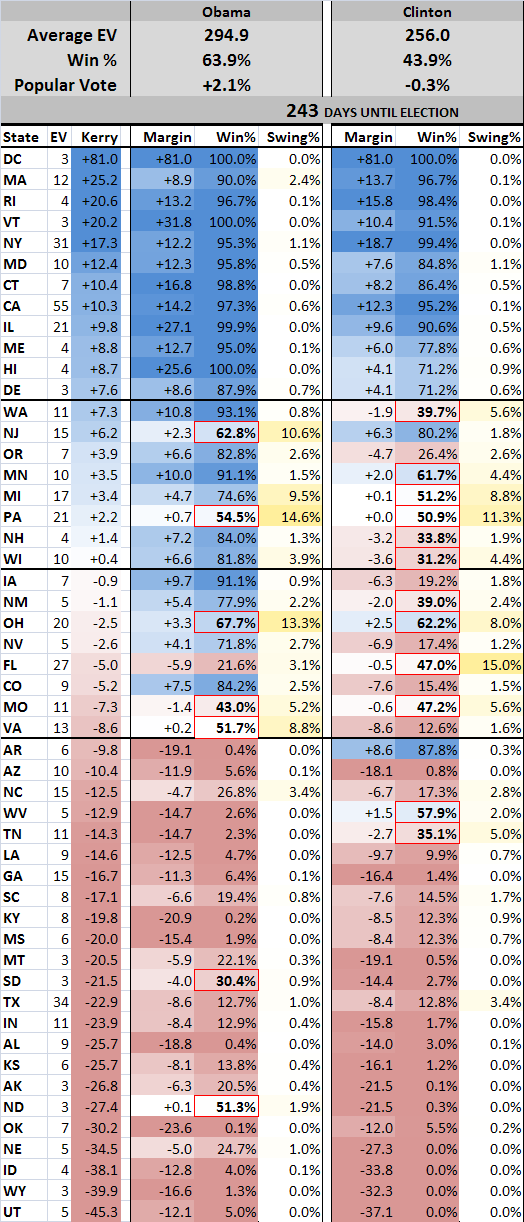
Obama's win percentage is basically unchanged from the last update, whereas Clinton's has moved up a bit. However, unlike in the Survey USA "winner-take-all" model, she still rates as the slight underdog to McCain. This is essentially because, as kos and Chris Bowers have pointed out, she has many fewer safe states than Obama. Obama has 22 states in which he's at least 70% to win, and collects 242 electoral votes from those states, almost enough to win the election by itself. But Clinton has just 14 safe states and 178 electoral votes by this definition, making her task considerably riskier.
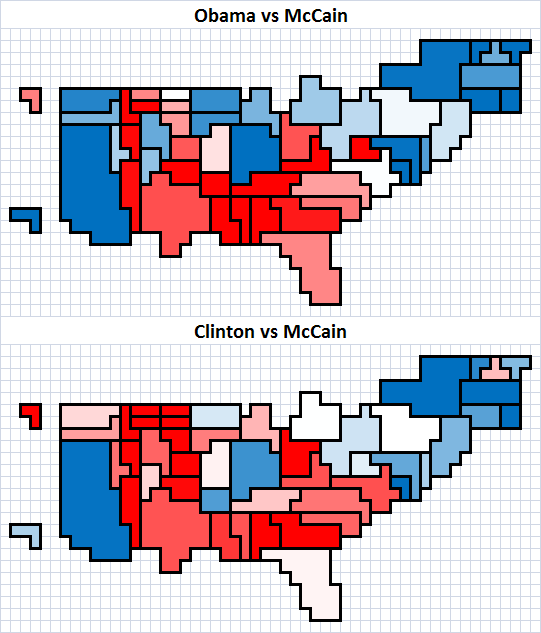
In terms of individual states, the results should not be too different from the Survey USA polls. The most notable difference is probably in Texas, where both other polls and the demographic data contradict Survey USA's assertion that the state is a toss-up.
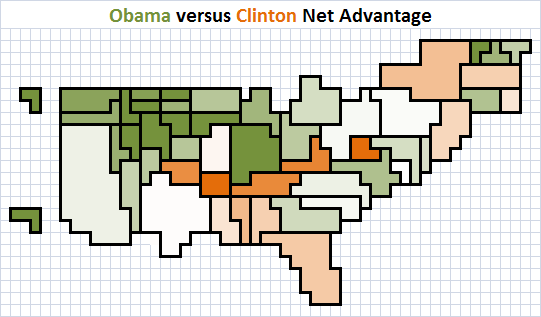
I have to give my model a little bit of a pat on the back for suggesting last time around that Obama could be competitive in some of the prairie states, although its guesses were slightly wrong -- it thought South Dakota and Montana looked like the best prairie states for Obama, for instance, whereas Survey USA seems to like North Dakota and Nebraska. Either way, this is one of several regions where Obama appears to have a distinct advantage over Clinton; others include the Upper Midwest, the Pacific Northwest, the "Four Corner" states (CO, NV, NM and AZ), and northern New England (e.g. New Hampshire and Maine). This is enough to outweigh an advantage for Clinton in Florida, New Jersey, Arkansas, West Virginia and Tennessee (along with some other states that are either too solid blue or too solid red to matter in the endgame).
In terms of resource allocation, the model suggests that Obama should be spending more than half his time between five states: Pennsylvania, Ohio, Michigan, New Jersey, and Virginia. Note that he is a slight favorite in each of these states, which is a sign of his strength. The model thinks that he should virtually ignore Florida, and might have an easier time trying to flip a state like North Carolina or Missouri.
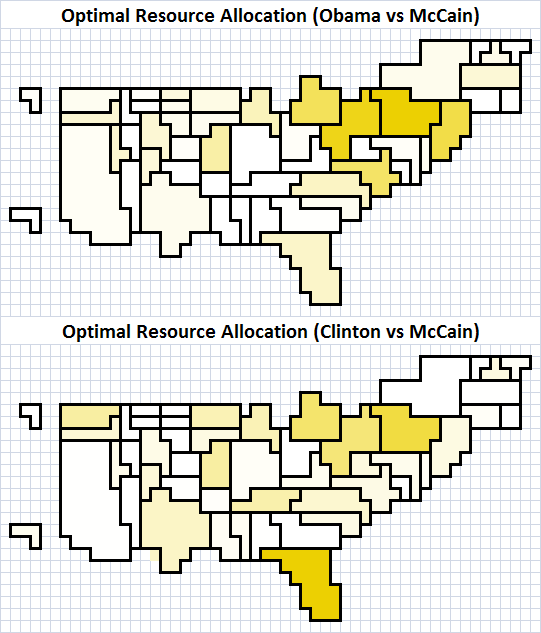
In a Clinton versus McCain matchup, on the other hand, Florida is the single most important state, and pretty close to a must-win for Clinton. She also has to play defense in several states like Washington and Wisconsin that should be fairly safe for Obama, and the model even thinks she should cut her losses and avoid states like Iowa and Nevada that Obama is favored to win. The model also suggests that she should be spending more time in the South; Tennessee and West Virginia are both worth her effort to win, and we have her spending a fair amount of time in Texas. This is not necessarily a sign of strength, however. We basically have her employing a high-risk, high-reward, "kitchen sink" strategy, devoting significant resources to trying to flip big red states like Texas and Florida, while hoping for the best in parts of the Gore/Kerry base that might be vulnerable.
UPDATE: Sorry, lotta typos.
UPDATE #2: Per a request, this is the probability distribution on electoral votes for each candidate.

UPDATE #3: I've got my website up to mirror/track this stuff and provide more frequent updates for the truly obsessed, but it's very much in beta test mode.
http://www.fivethirtyeight.com
